PYPLOT API IN MATPLOTLIB
In this tutorial, we will learn about the pyplot API in Matplotlib, we will learn about how to plot a simple graph and visually represent it using the data provided.
What is Pyplot API in Matplotlib?
Matplotlib.pyplot is a set of functions which enables matplotlib to act as MATLAB. Whenever you use pyplot, it creates a figure, plotting area and draws line within the plotted area according to the data provided.
Note: Whenever you are working in matplotlib, make sure that you import the Pyplot module to see the visual graph results. Let’s have a quick look at how to import pyplot module along with the matplotlib module:
import matplotlib
import matplotlib.pyplot as plt
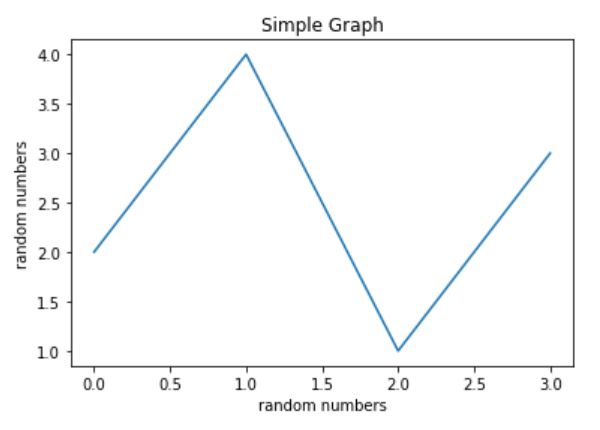
plt.plot([2,4,1,3])
plt.ylabel('random numbers')
plt.xlabel('random numbers')
plt.title('Simple Graph')
plt.show()
Output:
Types of Plots in Matplotlib
The above was a simple plot but you can create different types of plots using pyplot such as:
-
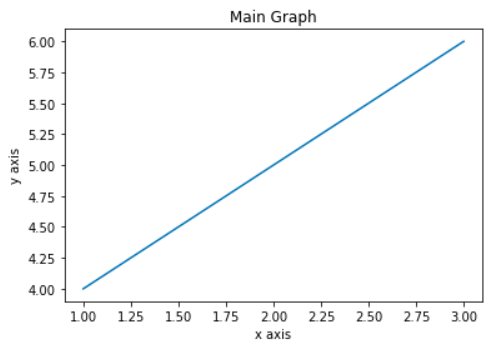
Line Plot
Line Plot is perhaps the most simple plot to visualize graphs quickly via single argument, of course you can put labels, titles and axes to make the most out of the graph. For Example:
-
Subplots
Matplotlib.pyplot API includes the subplot() function as well which helps us to create different/multiple plots rows and columns wise; which shows maximum information by displaying four different graphs to save time and hassle.

-
Histograms
A histogram is an amazing tool for analyzing and visualizing probability based numeric data that can be understood easily. Pyplot API offers in built feature of histogram as well. For Example:

-
3D Plotting
Matplotlib is preferable than MATLAB as it covers all the features that you can find difficult to find otherwise, for example MATLAB can take ages to process the data that you ingest in it but Matplotib does the same processing with a bunch of few libraries support like pyplot and mplot3d. After using these in a combination you can easily plot 3D data.
Other plots and charts supported by matplotlib.pyplot API are as follow:
- Paths
- Stream plot
- Bar Charts
- Pie Charts
- Tables
- Scatter plots

