PIVOT TABLES IN PANDAS
In this tutorial, we are going to learn about the pivot table in pandas and how a new view is created based on our preferences every time we pivot the dataframe.
What is a Pivot Table in Pandas?
If you are familiar with using Microsoft excel then you must be aware of pivot tables as it is the backbone for business analysis because it provides a fold of the data provided in new dimensions making data look more summarized and classified. We can use the pivot table in Pandas as well using the pivot_table() method. The syntax for pivot_table() is:
pandas.pivot_table(data, values=None, index=None, columns=None, aggfunc=’mean’, fill_value=None, margins=False, dropna=True, margins_name=’All’, observed=False) → ‘DataFrame'[source]
Lets work with our dataset (you can find the link here).
import pandas as pd
df = pd.read_csv('train.csv')
df.head()
Output:

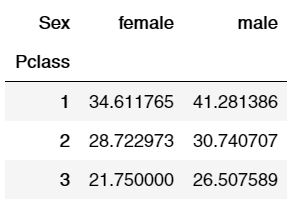
Let’s say that we want to find out the mean age of both male and female based on the Pclass they were travelling on, so how do we tell pandas to present us the desired dataframe? Well! The best way to do that is by using the pivot_table method.
df.pivot_table(index="Pclass", columns = "Sex" , values="Age", aggfunc='mean')
Output:

The above result folds the data based on what we want and displays a new dataframe. Let’s work with another example where we are going to work with german credit data and analyze it through different ways.
gc = pd.read_csv('german_credit.csv')
gc.head()
Output:

Let’s say that we want to find out about the mean of Credit Amount(Loan) taken for different purposes based on Sex, so we will calculate it using pivot_table.
gc.pivot_table(index="Purpose", columns = ['Sex'] , values="Age", aggfunc='mean')
Output:

Difference Between pivot() and pivot_table() Method:
pivot() and pivot_table() are two different methods as both of them serve different purposes. Main difference between these two methods is:
- pivot() is used for pivoting the dataframe without applying aggregation. Hence, it doesn’t contain duplicate values or columns/index.
- pivot_table() on the other hand will pivot the dataframe by applying aggregation on it, and it will work with managing duplicate values or columns/index


