GROUPBY IN PANDAS
In this tutorial, you will learn about the groupby function in Pandas and how to create subsets of your existing dataframe by classifying the information that you need.
What is Groupby in Pandas?
Pandas is an awesome tool for classifying data into groups through the groupby() method. We can distribute the objects in pandas on any of their axis. In short, groupby means to analyze a pandas Series by some category.
In short, if you have repeated categories in your dataset, then you can create groups in order to classify your data into sub groups. Remember, it won’t be wise to perform groupby method on unique values. Let’s look at the syntax of groupby to understand it in more depth:
DataFrame.groupby(self, by=None, axis=0, level=None, as_index=True, sort=True, group_keys=True, squeeze=False, observed=False, **kwargs)
We will import a csv file by using the read_csv method. You can find the csv file here
import pandas as pd
countries = pd.read_csv('countries.csv')
countries.head()
Output:

Let’s say we want to group the dataframe by the region, so we can simply use the groupby() method:
countries.groupby('Region')
Output:
When we apply the groupby function, a pandas object is returned. So in order to work around that, we need to store the grouped dataframe in a variable:
region_groupby = countries.groupby('Region')
region_groupby
Output:
It still is returned as an object, but now our pandas is stored inside a variable and we can call that variable with different methods as a grouped entity, so let’s look at the size of the grouped region dataframe:
region_groupby.size()
Output:
Region
ASIA (EX. NEAR EAST)                   28
BALTICS                                 3
C.W. OF IND. STATES                    12
EASTERN EUROPE                         12
LATIN AMER. & CARIB                    45
NEAR EAST                              16
NORTHERN AFRICA                         6
NORTHERN AMERICA                        5
OCEANIA                                21
SUB-SAHARAN AFRICA                     51
WESTERN EUROPE                         28
dtype: int64
Let’s take out the population sum of distributed region area:
region_groupby.Population.sum()
Output:
Region
ASIA (EX. NEAR EAST)                   3687982236
BALTICS                                   7184974
C.W. OF IND. STATES                     280081548
EASTERN EUROPE                          119914717
LATIN AMER. & CARIB                     561824599
NEAR EAST                               195068377
NORTHERN AFRICA                         161407133
NORTHERN AMERICA                        331672307
OCEANIA                                  33131662
SUB-SAHARAN AFRICA                      749437000
WESTERN EUROPE                          396339998
Name: Population, dtype: int64
You can apply the aggregation function on the population over the region category:
region_groupby.Population.agg(['count','sum','min','max'])
Output:

Groupby in Pandas: Plotting with Matplotlib
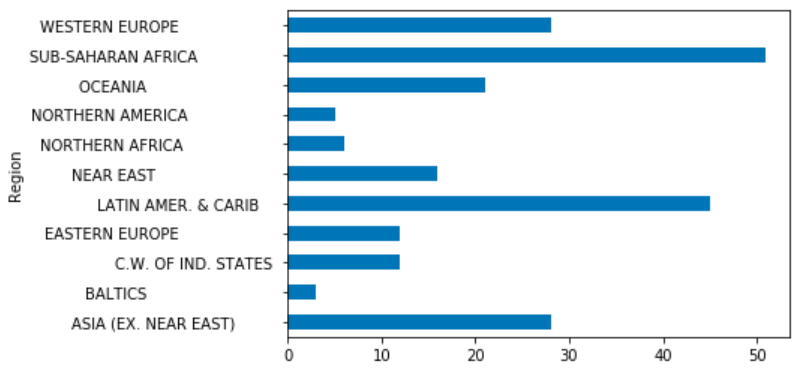
You can create a visual display as well to make your analysis look more meaningful by importing matplotlib library. For example, you want to know the number of Countries present in each Region.
import matplotlib.pyplot as plt
df.groupby('Region')['Country'].count()
Output:
Region
ASIA (EX. NEAR EAST)                   28
BALTICS                                 3
C.W. OF IND. STATES                    12
EASTERN EUROPE                         12
LATIN AMER. & CARIB                    45
NEAR EAST                              16
NORTHERN AFRICA                         6
NORTHERN AMERICA                        5
OCEANIA                                21
SUB-SAHARAN AFRICA                     51
WESTERN EUROPE                         28
Name: Country, dtype: int64
Let’s plot the result now:
df.groupby('Region')['Country'].count().plot(kind="barh")
plt.show()
Output:


